Richardson’s Fantastic Forecast Factory
by Peter Lynch, School of Mathematics & Statistics, University College Dublin.
In 1922 Lewis Fry Richardson published a remarkable book, Weather Prediction by Numerical Process, describing his attempt to forecast changes in the weather by numerical means.


Weather Prediction by Numerical Process
Richardson devised a method of solving the mathematical equations that describe atmospheric flow by dividing the globe into cells and specifying the dynamical variables at the centre of each cell. In Chapter 11 of his book, he presents what he calls a ‘fantasy’, describing in detail his remarkable vision of an enormous building, a fantastic forecast factory.
Several artists have created images of the forecast factory. One particular image, which has recently come to light, is described here. The painting, in ink and water colours, was made by the Irish artist Stephen Conlin in 1986, on the commission of Prof. John Byrne, then Head of the Department of Computer Science in Trinity College, Dublin, who provided both Richardson’s text and suggestions regarding the inclusion of important figures from the history of mathematics and computation.
Richardson’s Fantasy.
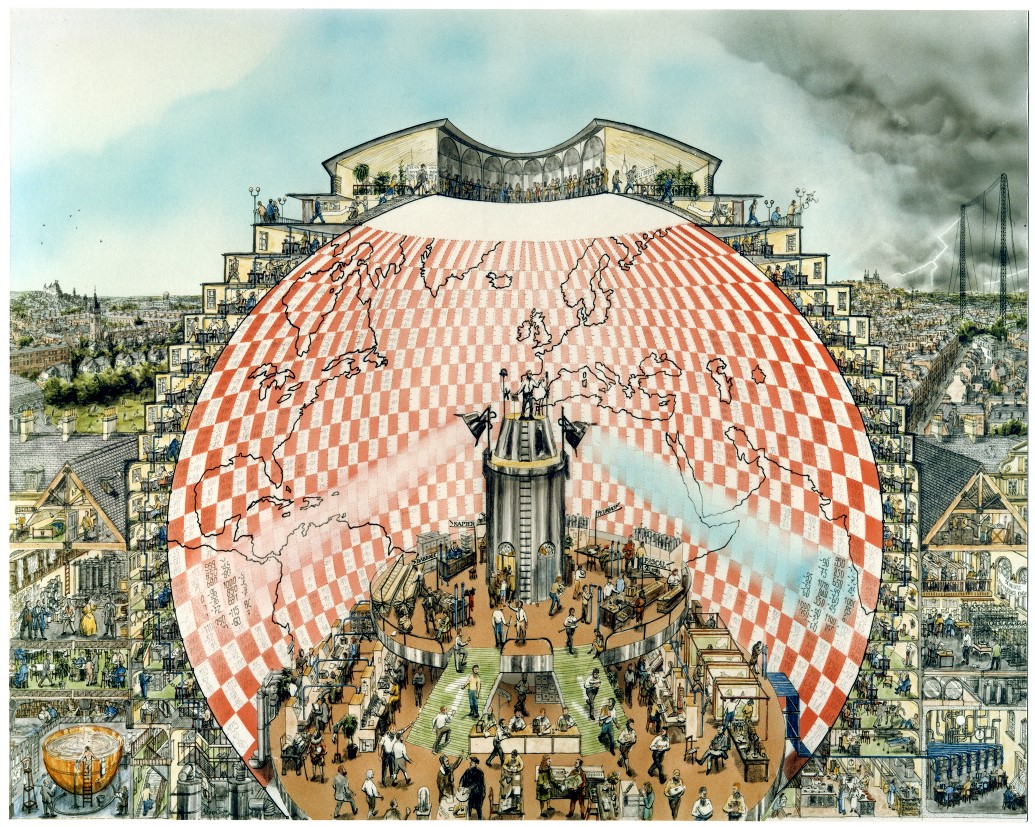
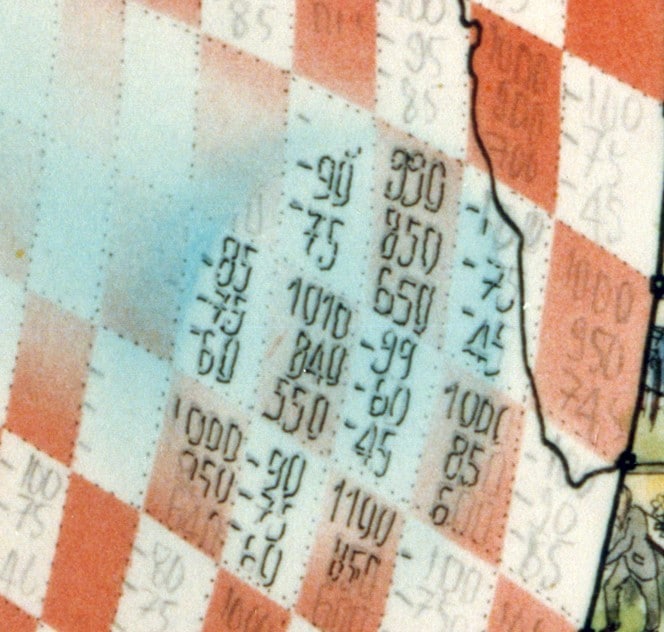
Richardson showed remarkable foresight when he penned his famous fantasy; his description is in Weather Prediction by Numerical Process, page 219 (see the text below figure 1). Conlin’s image depicts a huge building, some twenty storeys high, with a vast central chamber, spherical in form. On the wall of this chamber is a map with roughly half the globe visible, divided into red and white chequers. The numbers in the red cells represent pressure at the model levels (Richardson’s model had five layers) and those in the white cells are momenta or winds.
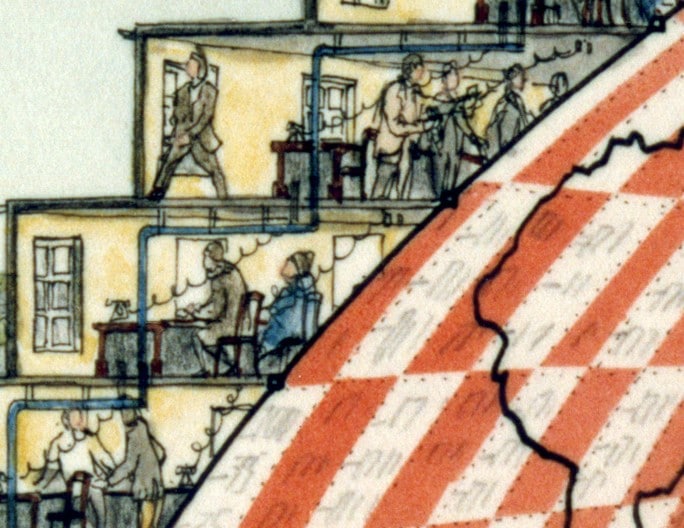
Richardson describes how “A myriad computers are at work upon the weather of the part of the map where each sits … . The work of each region is coordinated by an official of higher rank.” The image divides the globe into about twenty zones.
The upper floor, with the desks of four senior clerks, is shown below the central column. A banner on each desk identifies a major figure in the history of computing. The Director of Operations stands on a dais atop the central tower, “like the conductor of an orchestra in which the instruments are slide-rules and calculating machines”. He coordinates the computations, signalling with a red spotlight to those who are racing ahead, and with a blue light to those who are behindhand.
There are striking similarities between Richardson’s forecast factory and a modern massively parallel processor (MPP). Richardson envisaged a large number of processors – his estimate was 64,000 – working in synchronous fashion on different sub-tasks. The forecasting job was sub-divided, or parallelized, using domain decomposition, a technique often used in MPPs today.
Historical Characters in the Image
Several scholars and savants are depicted in the painting of the forecast factory. The artist, Stephen Conlin, provided a numerical key to the most important of these. It is reproduced in this Figure.
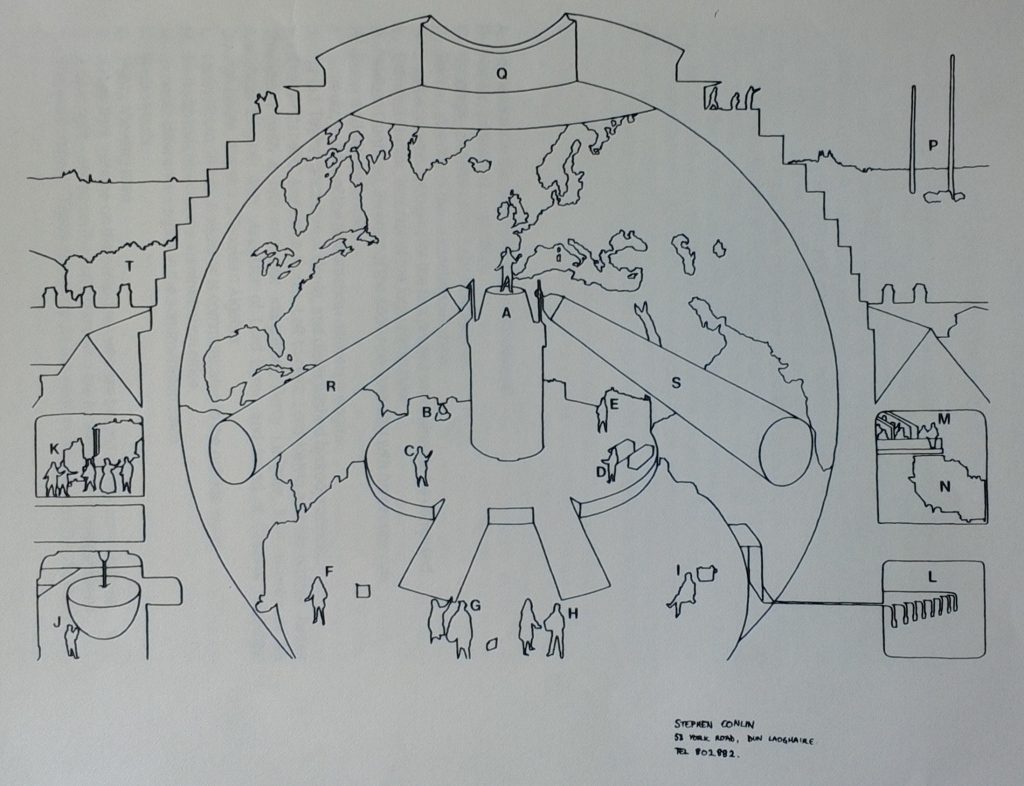
Table 1: list of individuals in the figure
A Lewis F. Richardson (1881-1953) in the pulpit, directing operations.
B John Napier (1550–1617) inventor of logarithms, which had a profound influence on the course of astronomy, and of science in general.
C Charles Babbage (1791-1871), mathematician, inventor and mechanical engineer, originated the concept of a programmable computer and designed highly advanced mechanical calculating machinery.
D Blaise Pascal (1623–1662) French mathematician, inventor, writer and philosopher. When only 18 years old, he constructed a mechanical calculator capable of addition and subtraction, called the Pascaline.
E Georg von Peurbach (1423–1461), Austrian astronomer and instrument maker who arranged for the first printed set of sines to be computed. He also computed a set of eclipse tables, the Tabulae Eclipsium, which remained highly influential for many years.
F Edmund Gunter (1581-1626), English clergyman and mathematician, inventor of the logarithmic ruler.
G William Oughtred (1574-1660), English mathematician and Anglican minister, inventor of the slide rule.
Walter Lilly (c. 1900), Lecturer in Mechanical Engineering, Trinity College Dublin, with his circular rule.
H Gottfried Wilhelm von Leibniz (1646-1716), mathematician and philosopher, who
invented the first mass-produced mechanical calculator. His ‘Stepped Reckoner’, which performed addition, subtraction, multiplication and division, is illustrated on the table behind him, between Leibniz and George Fuller (one-time Professor of Engineering at Queen’s College, Belfast) with his spiral rule.
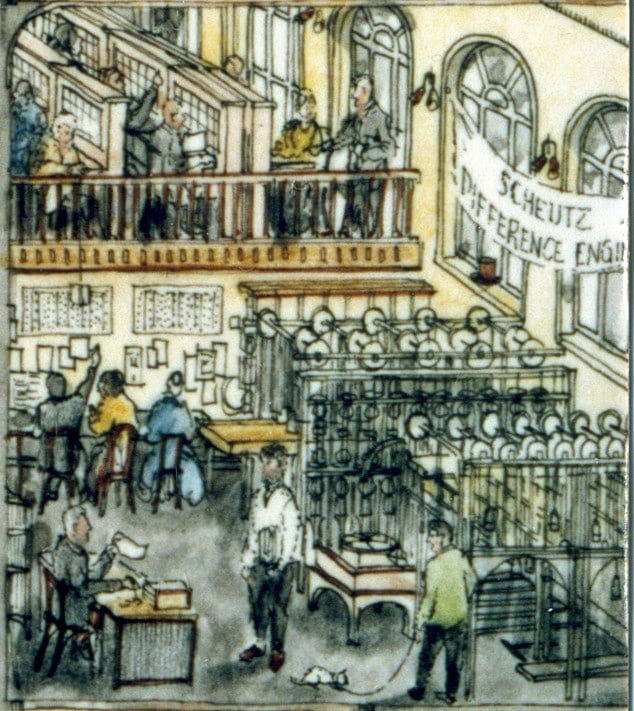
I Per Georg Scheutz (1785-1873), Swedish lawyer, translator, inventor and builder of the first practical difference engine. Scheutz’s calculator was used for generating tables of logarithms.
J Sir G. I. Taylor (1886-1975), distinguished hydrodynamicist, grandson of George Boole.
K The Arithmetic Research Room. Left to right:
Lord Kelvin (1824-1907) and his brother James Thomson (with a ball and disk integrator);
Percy Ludgate (1883-1922), Irish inventor of an Analytical Engine;
Ada Lovelace (1815-1852), daughter of Lord Byron and friend of Babbage;
George Boole (1815-1864), inventor of Boolean algebra.
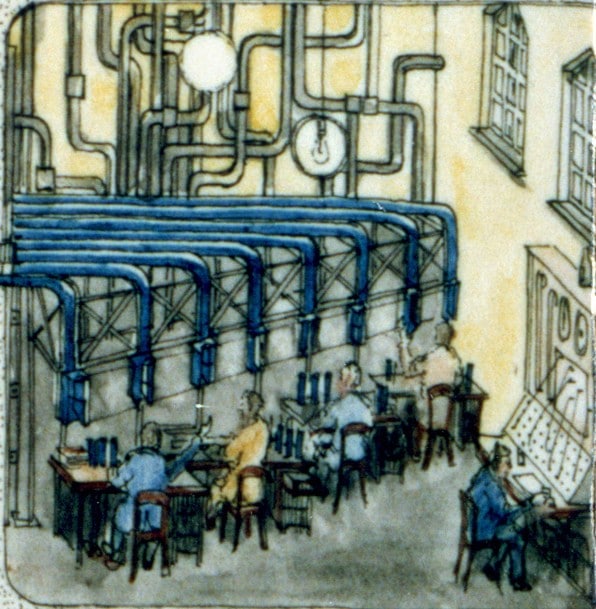
L Tube Room, or “quiet room”, in which weather information is communicated within the forecast factory by pneumatic tube and to and from the outside world by wireless telegraphy.
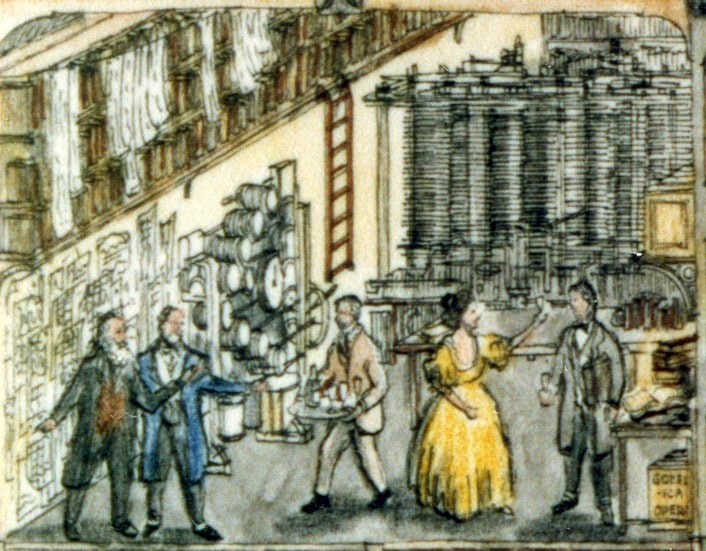
M Hollerith machines in the research department.
N Scheutz Difference Engine in the research department.
P Radio masts for reception of observations and transmission of forecasts.
Q Public viewing gallery.
R A rosy light – shone on computers who are forward in their computations.
S A blue light – shone on computers who are behind in their computations.
T Recreation area, since “those who compute the weather should breathe of it freely”.
Weather Prediction by Numerical Process, page 219
Richardson’s Fantasy
After so much hard reasoning, may one play with a fantasy? Imagine a large hall like a theatre, except that the circles and galleries go right round through the space usually occupied by the stage. The walls of this chamber are painted to form a map of the globe. The ceiling represents the north polar regions, England is in the gallery, the tropics in the upper circle, Australia on the dress circle and the antarctic in the pit.
A myriad computers are at work upon the weather of the part of the map where each sits, but each computer attends only to one equation or part of an equation. The work of each region is coordinated by an official of higher rank. Numerous little “night signs” display the instantaneous values so that neighbouring computers can read them. Each number is thus displayed in three adjacent zones so as to maintain communication to the North and South on the map.
From the floor of the pit a tall pillar rises to half the height of the hall. It carries a large pulpit on its top. In this sits the man in charge of the whole theatre; he is surrounded by several assistants and messengers. One of his duties is to maintain a uniform speed of progress in all parts of the globe. In this respect he is like the conductor of an orchestra in which the instruments are slide-rules and calculating machines. But instead of waving a baton he turns a beam of rosy light upon any region that is running ahead of the rest, and a beam of blue light upon those who are behindhand.
Four senior clerks in the central pulpit are collecting the future weather as fast as it is being computed, and despatching it by pneumatic carrier to a quiet room. There it will be coded and telephoned to the radio transmitting station. Messengers carry piles of used computing forms down to a storehouse in the cellar.
In a neighbouring building there is a research department, where they invent improvements. But there is much experimenting on a small scale before any change is made in the complex routine of the computing theatre.
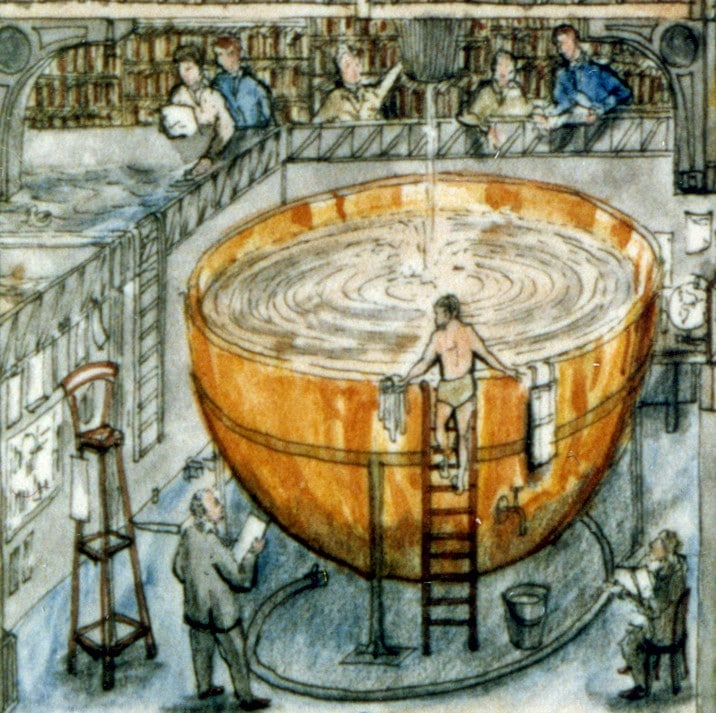
In a basement an enthusiast is observing eddies in the liquid lining of a huge spinning bowl, but so far the arithmetic proves the better way. In another building are all the usual financial, correspondence and administrative offices.
Outside are playing fields, houses, mountains and lakes, for it was thought that those who compute the weather should breathe of it freely.
Communications & Computing
Blue pneumatic tubes can be seen throughout the building. These were used to transport documents to and from a centralized Tube Room, shown at the bottom right corner of the image. An electrical switch-board nearby controlled the distribution of forecasts by radio transmission. A radio antenna is seen near the top right side of the main picture.
In the building on the right side of the image (above the Tube Room) there is a large room containing computing equipment. This is where senior operatives are developing strategies for improving the forecasting operations. At the lower left corner, we see “an enthusiast … observing eddies in the liquid lining of a huge spinning bowl … ”.
Richardson, with his Quaker background, was no slave-driver. He anticipated the need for what we now call a good work-life balance: “Outside are playing fields, houses, mountains and lakes, for it was thought that those who compute the weather should breathe of it freely.” This quotation is indicative of Richardson’s humanitarian spirit. At centre-right, we see parkland where people are playing sports or relaxing.
Summary
Conlin’s painting, which has gone unnoticed for many years, is a remarkable work, rich in detail and replete with hidden gems. The above extracts are just a small sample of what the original image contains. Examination of the high-resolution image with a computer visualisation program is a rewarding experience and will reveal a wealth of other interesting details.
Acknowledgements
My thanks first to Prof. John Byrne for allowing a copy of his painting to be made and used, and for consultation regarding the background to it, and to Dr Dan McCarthy, Trinity College Dublin, who brought the painting to my attention, and arranged the high-resolution scan of it. Thanks also to Hendrik Hoffmann of UCD for re-sampling and compressing the images. Finally, special thanks to the artist, Stephen Conlin, for generously permitting reproduction of the image and for information about it.
Peter Lynch
UCD Dublin
October 2015.
References.
Ashford, Oliver, M., 1985: Prophet – or Professor? The Life and Work of Lewis Fry Richardson. Adam Hilger, Bristol & Boston, 304pp.
Conlin, Stephen, Artist: For a range of work by the artist, see http://www.pictu.co.uk/
Lynch, Peter, 2006: The Emergence of Numerical Weather Prediction: Richardson’s Dream. Cambridge University Press, 279pp.
ISBN-13: 978-0-521-857291.
Lynch, Peter, 2016: An Artist’s Impression of Richardson’s Fantastic Forecast Factory. To appear in Weather. PDF preprint
Richardson, Lewis Fry, 1922: Numerical Prediction by Numerical Process, Cambridge Univ. Press. Second Edition (corrected version of the original with a new Foreward by Peter Lynch), Cambridge University Press 2007: ISBN: 978-0-521-68044-8.