Niels Hoffmeyer – a great but forgotten Danish meteorologist
This article was first published in Vejret, the journal of the Danish Meteorological Society, no 157, in 2018. It was translated into English for publication here by the author, Anders Persson.

“Reanalysis” is something we associate with long-term projects at institutions such as the ECMWF and NCEP. But how many know that it was a Danish meteorologist, Niels Hoffmeyer (Figure 1), who launched the first “reanalysis project” at the end of the 19th century? And how many know how important his work was for the development of Polar Front meteorology?
One day, as I sat down and arranged my copies of “Vejret“, the quarterly journal of the Danish Meteorological Society, I discovered that I had never read some issues from 2014 carefully. I had just become a member of the Society and they had sent me a bundle of issues, but I had not found time to read them. But now, among many other interesting articles, I found an article about the first Director of the Danish Meteorological Institute Niels Henrik Cordulus Hoffmeyer in the August 2014 issue (Rasmussen, 2014).
After a brief introduction, the article quoted a detailed biography from an obituary in “Geografisk Tidskrift” (Geographical Magazine) from 1884. Hoffmeyer’s work on “reanalysis” was only mentioned at the end of the obituary. At this time, more than one hundred and thirty years ago, it was not possible to see the significance that this “reanalysis” would have for the scientific development of meteorology.
As an artillery officer in the 1864 Second Schleswig War, Hoffmeyer (1836-84) had been wounded and sent home. For medical reasons he had to see specialists in Paris. During his stay there in 1865-66 he not only learned fluent French but he also became interested in practical and theoretical meteorology. We have no details about his stay in Paris, but the fact that he got caught up by the excitement of weather charts is not a coincidence. After the weather disaster in 1854 during the Crimean war, the French astronomer Urbain Leverrier (1811-77), Head of the Paris Observatory, had started meteorological activity in France just before Hoffmeyer arrived. In 1863 the first public weather maps were displayed in the ports. Within the observatory, a daily analysis over the North Atlantic and Europe was conducted (Locher, 2008).
When Hoffmeyer got back home he suggested that the Danish government ought to organise a meteorological service similar to the one he had seen in Paris. This came to pass, and on 1 April 1872 a “Meteorological Institute” was opened under the Marine Ministry.
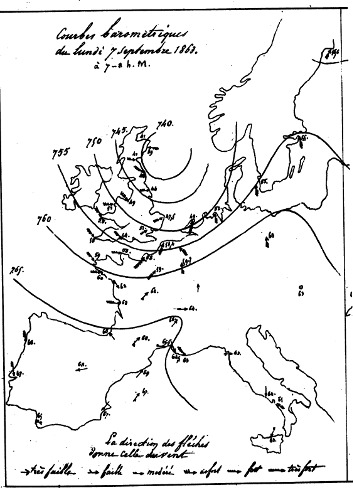
Starting in 1876, Hoffmeyer began to collect all available observations from the North Atlantic (Iceland, the Faroe Islands, Greenland, and ships) for the three previous years (1873-75), plot them on maps, and analyse them by drawing isobars. These maps were then published annually. Five years later, when the printing of the maps became too expensive for the Danish state, the “Deutsche Seewarte” (German Marine Weather Service) in Hamburg took over the work until the first world war. The analyses continued, as before, to be made in Copenhagen. The “Hoffmeyer maps” are thus another nice example of European scientific cross-fertilization.
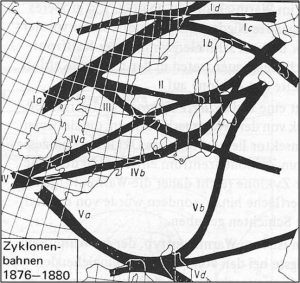
As outlined in Kutzbach (1979, p. 236-37), these maps were highly valued by contemporary researchers, in particular Wladimir Köppen (1846-1940) and Wilhelm van Bebber (1841- 1909) in their work of 1877-91 to map typical storm tracks (Sestoft, 1972, pp. 25-26).
When Vilhelm Bjerknes and his group in Bergen, Norway, began to develop their system of air mass analysis, fronts, and cyclones around 1919, they found support in Hoffmeyer’s maps. The isobaric analysis was quite accurate because Hoffmeyer carefully took into account Buys Ballot’s wind-law, what we call now the geostrophic approximation. It was therefore possible for the Bergen meteorologists to insert the fronts with great certainty in many of the “kinks” in the isobars.
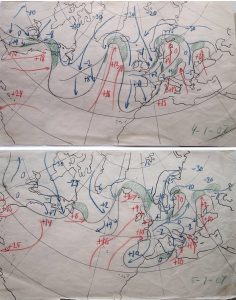
It is always said that the Bergen School relied on a small but observationally dense area in Scandinavia. But how did they then discover the “cyclone families”, i.e. how new cyclones formed upstream of the lagging cold front? This was something that required analyses over large areas.
Yes, this is where the Hoffmeyer maps came in again. In March 1920 the penny dropped for one of the Bergen School meteorologists, Halvor Solberg: “During Jack Bjerknes’ absence I reflected on the Hoffmeyer charts. I managed to find something which we had suspected for a long time, namely a line of discontinuity in temperature, wind, etc. which stretched right across the map from one side to the other. There is no doubt at all that this line continues all around the Pole, even if the Hoffmeyer charts do not extend so far. To the North of the line we have ‘cold Polar air’, to the South we have ‘warm Equatorial air’. It is also along this line that rain falls, in most cases at least. It marks the front battle-line between two bodies of air and that is why it has such a contorted course, since now the warm and then the cold has dominance over the other.”(Jewell, 1981a, p.829; Jewell, 1981b, p. 489)
I am not sure if I’ve read it in somewhere in Vilhelm Bjerknes’s publications or if Tor Bergeron told us when we were young students in the 1960s, but Bjerknes had torn his hair out in despair and wondered how meteorologists for almost 50 years could have been be so blind that they had not, with Hoffmeyer’s maps in front of them, noticed the cold and warm fronts from the isobaric patterns. Had they done that, polar-front theory could have been discovered as early as the 1880s. However, around 1920 in the hands of Bjerknes and his young colleagues it was different. This is a nice example of the fact that you do not only develop theories from observations; quite often you need a theory to discover the message in the observations!
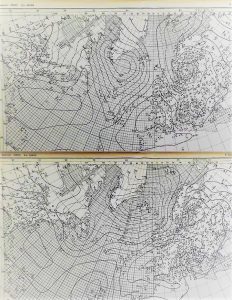
This article would not be complete if we didn’t include an example from a present-day reanalysis dataset. Below is the 1907 situation as depicted by the current ECMWF reanalysis project (source: Wetterzentrale Archive http://www.wetterzentrale.de/de/reanalysis.php).
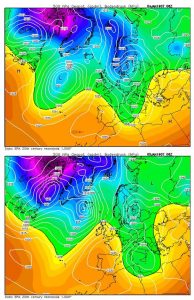
With modern computer techniques using the so called “variational analysis” it is not only possible to make a more accurate analysis over data sparse areas, e.g. over the oceans, but also to deduce the flow at higher levels. Interestingly, there are significant differences in the reanalyses of the Icelandic cyclone. The NOAA reanalysis (not shown here) seems to be more in line with Hoffmeyer’s careful analysis 130 years ago.
This seems to suggest that not even the science of reanalysis is an “exact science”. Hopefully, more observations from the historical archives and further advanced analysis systems will narrow the gap between reality and hindcast estimations.
References
Fleming, J.R. 2016: Inventing Atmospheric Science. MIT Press.
Hoffmeyer, N, 1876-80, Cartes synoptiques journalières, embrassant l’Europe et le Nord de l’Atlantique, sept. 1973-nov. 1876. Copenhague 1876-80.
Jewell, R.1981a: The Bergen School of Meteorology – The Cradle of modern weather forecasting. Bull. Am. Met. Soc. Vol 62, No 6 June 1981 824-830. Also in “Research in Norway 1979”, pp 1-8, where the maps are in colour.
Jewell, R. 1981b: Tor Bergeron’s First Year in the Bergen School: Towards an Historical Appreciation, Pure and Applied Physics, vol 119, pp. 474-90
Kutzbach G. 1979: The Thermal Theory of Cyclones, Am Met Soc. pp 255.
Locher, Fabien (2008), Le Savant et la Tempête. Étudier l’atmosphère et prévoir le temps au XIXe siècle [The sage and the tempest. Study the atmosphere and forecast the weather in the XIX Century], Carnot (in French), Rennes: Presses Universitaires de Rennes.
Rasmussen, L 2015: Niels Henrik Codulus Hoffmeyer – hvem var han? , Vejret, august 2014 22-27.
Sestoft, I, 1972: Dansk meteorologi genom tiderne (Danish meteorology through the ages), in “Meteorologisk Institut 1872-1972” (ed. Karl Andersen), pp.7-100
By Dr Anders Persson, Danish Meteorological Society
Kommentare sind geschlossen.